Monitoring Response Times using Nginx, Telegraf and InfluxDB
In these posts, I talk about the steps I took in order to monitor some aspects of a microservice application deployed on Kubernetes cluster. I’m aggregating data about 1.the number and server-side response time for each endpoint. 2. The allocated resource to each microservice at each moment and 3. resource utilization (only CPU for now) of each microservice. This first part only focuses on storing and retrieving information about the incoming requests.
What I did is highly inspired by this.
Telegraf and InfluxDB
InfluxDB is a time-series database. As the website mentions, Telegraf is the open-source server agent to help you collect metrics from your stacks, sensors and systems. Telegraf’s role is to make our lives much easier by providing different plugins which make gathering data from different resources and reporting them to different targets extremely easy. I suggest you take a look at Telegraf’s inputs and outputs lists. There are also other modules like parsers, aggregators.
Aggregating Request Count and Response times
In one paragraph, we use Nginx as a gateway in front of our server and use its logging system to report information about each request to a Syslog server. These logs are parsed in a simple Go code and then reported to Telegraf. Telegraf group the information in different batches and send them to InfluxDB. The InfluxDB in this post could be easily replaced by any other output in the long list of Telegraf’s outputs.

There are 4 main steps:
- Reporting data using Nginx
- Preparing data for Telegraf
- Gather data with Telegraf and sending them to InfluxDB
- Write the query to get what we need from InfluxDB
Step 1: Nginx Logs the data
Many systems are already using nginx in front of their systems, so I thought it should be the best system to go for. Independent of what is happening in nginx config file, by adding these two lines we achieve our goal:

In the first line, log_format is defining a new structure for the log named influxdb. Any word which doesn’t start with $ would go to the log unchanged and the ones with $ would be replaced by Nginx. How fancy this part is, would be your call, you can add as much information as you want but make sure to keep follow a few rules (this and that). Also another factor to consider is the structure of logs. As mentioned before these logs would be gathered using Telegraf and would be reported to the InfluxDB. So we are using the InfluxDB line protocol. In this format you specify tags and fields for InfluxDB.
The second line tells Nginx to send the logs with the specified structure to a Syslog listener which is defined using TELEGRAF_SYSLOG_SERVER environment variable.
An example of the nginx-conf is available at Github repo. Remember that in production the environment variables would be replaced with actual values using envsubst before the config file be used.
Step 2: Preparing data for Telegraf
The Nginx is reporting all the data we need to the Syslog. Syslog is a network-based logging protocol. Now we need to get these data and report it to InfluxDB. Syslog is a well known system and I’m sure there are many tools and frameworks for dealing with it. So why are we going to use Telegraf to do the reporting? I can think of three reasons:
- Telegraf can handle many different types of inputs to gather data and can report them to various types of outputs. So if one day we stop loving influxDB and decide to move to prometheus it would be very simple.
- Telegraf performs some magical buffering to optimize the reporting process.
- We hate to reinvent the wheel.
Now that you are convinced, the next step is to use Telegraf to gather these logs and report them to InfluxDB. This took more time than what I expected as the format which Nginx sends its logs with (RFC3164) is not supported by Telegraf. There is a commit in Telegraf’s Github which adds this support but it’s not in the main version yet. I suggest you keep an eye if you are using this tutorial (I try to update this when the Telegraf started supporting RFC3164). Back then, I wrote a simple Go code which would play the role of the Syslog server and prints the logs. The code is available here.
It also worth mentioning the blog post I mentioned earlier, handles this issue by writing logs to a file using Nginx and passing the address of that file to Telegraf, so you have that option too.
Step 3: Gather data with Telegraf and sending them to InfluxDB
Unsurprisingly, Telegraf comes with a config file. Surprisingly, it is an interesting one. You can get your own using:

You can see it has different inputs and outputs. While it has the inputs.syslog option, because of what we talked about in the second step, we can’t use it for now. We are going to use inputs.execd and our compiled Go code. Check that out here. It would be something like this:

command = [“/get_logs”] specifies for Telegraf what to run, (in this case the program in the root of container). data_format = “influx” tells Telegraf it should expect Influx line protocol in the stdout of the program it is running in background (/get_logs). For sending this data to output, we go for outputs.influxdb_v2. Checkout the config file here, or:

Note that Telegraf replaces the environment variables in the config file before starting, so use them with no concern.
Next, you need is to glue things together and decide how you want to run these. The Docker files and config files are available in this repository. The Readme file, also explains the role of each env and how to set them. I packed the Nginx in one container and the Telegraf in another. Later deployed both of them in the same pod in Kubernetes. One of the benefits of this system, is that it can easily be scaled by adding more instances of this pod.
Step 4: Write the query to get what we need from InfluxDB.
If all goes well, now InfluxDB has all the information we need. Let’s take a look at what we can see in the DB.
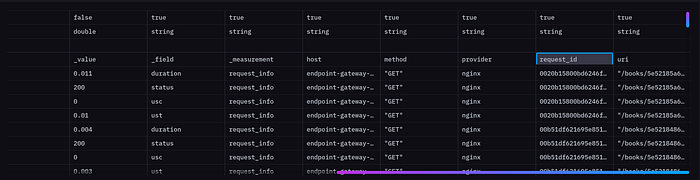
What I needed in the first place was server-side response times and number of requests at different time intervals. If you check out the log_format from nginx, I’m storing $upstream_response_time inside ust. The http_method inside method and address of the request as uri. I only kept method and address because I can distinguish different endpoints by these two, you might need to add additional information to the Nginx log.
Now we need to come up a with a query which reports the response times for an endpoint. For example, my toy system (the bookstore application) has a GetBook request type which can be identified by GET requests to /books*. This InfluxDB query provides response times for GetBook endpoint:

Note that =~ is used for regex. You can combine this with other aggregate functions in InfluxDB to get count, mean or percentiles of response times.
I’m sure there are 10²⁰ ways to what I did here and I’m pretty sure 10¹⁰ of them are better. Still, I hope this could help someone one day (or at least myself in future). Also, stay tune for the next article and as always I’d love to hear your feedbacks.